Personal project · 2026.7-2026.10
Data center thermal simulation
and operations analysis
I built a six-rack thermal and airflow model to compare airflow, rack loads and cooling-route changes for maintenance assessment.
COMSOL 6.2Java APIPython
- Room model
- 6racks
- Cooling scenarios
- 4scenarios
- Monitoring data
- 32points
Project context
Assessing rack temperatures
with one cooling route shut down
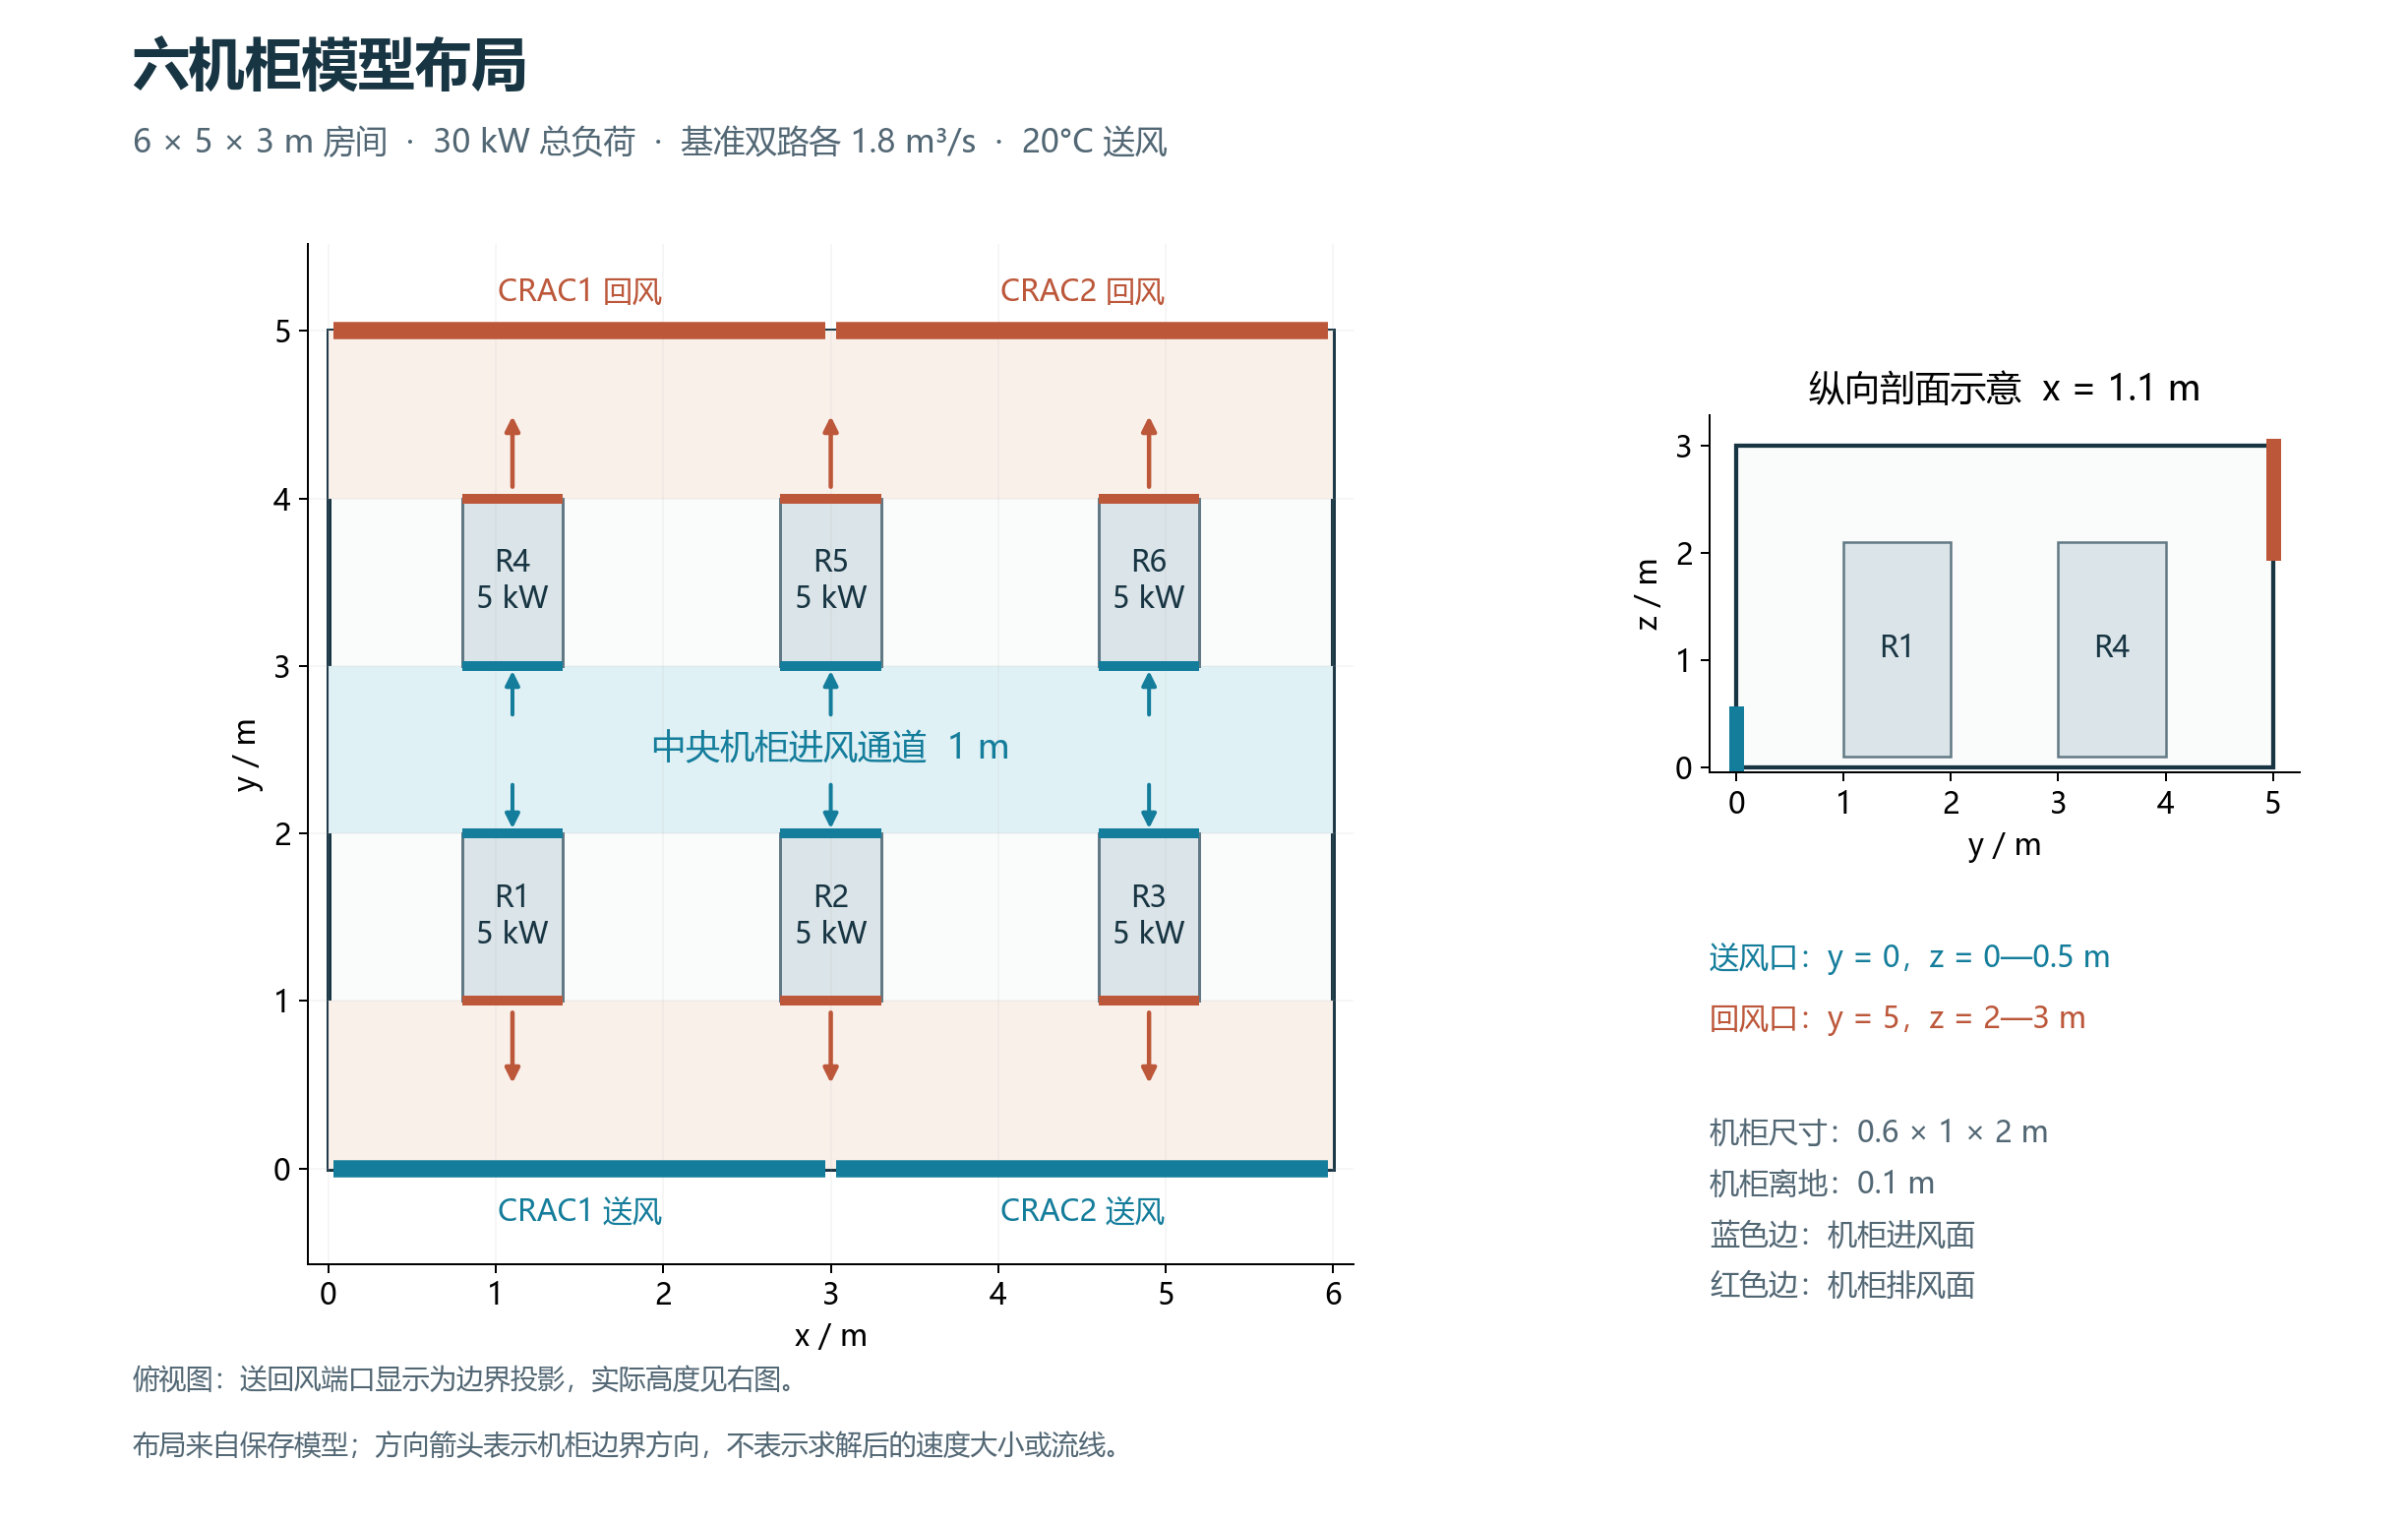
I modeled six racks supplied by two cooling routes, then compared reduced airflow, adjusted rack loads and shutdown of one route.
- Room dimensions
- 6 × 5 × 3 m
- Total rack load
- 30 kW
- Supply temperature
- 20°C
- Normal airflow
- 3.6 m³/s
My contribution
- 01
Built the thermal and airflow model
Built a six-rack room model with two cooling routes in COMSOL, defined rack loads, materials and airflow boundaries, and modeled airflow, heat transfer and buoyancy.
- 02
Designed and calculated four scenarios
Used normal airflow as the reference and varied total airflow, rack load distribution and cooling routes. Completed 0–23 s transient calculations for four scenarios and compared intake temperatures and local hotspots.
- 03
Automated model calculations
Used Java API for modeling, solving and data export, and Python to manage calculation runs, check saved times, units and data completeness, and generate comparison plots.
- 04
Documented monitoring data and maintenance workflows
Mapped temperature and airflow data to 8 equipment assets and 32 monitoring points, compiling 3,072 simulation records. Used rack temperature differences to document events, problems, risks and maintenance-change workflows.
Results
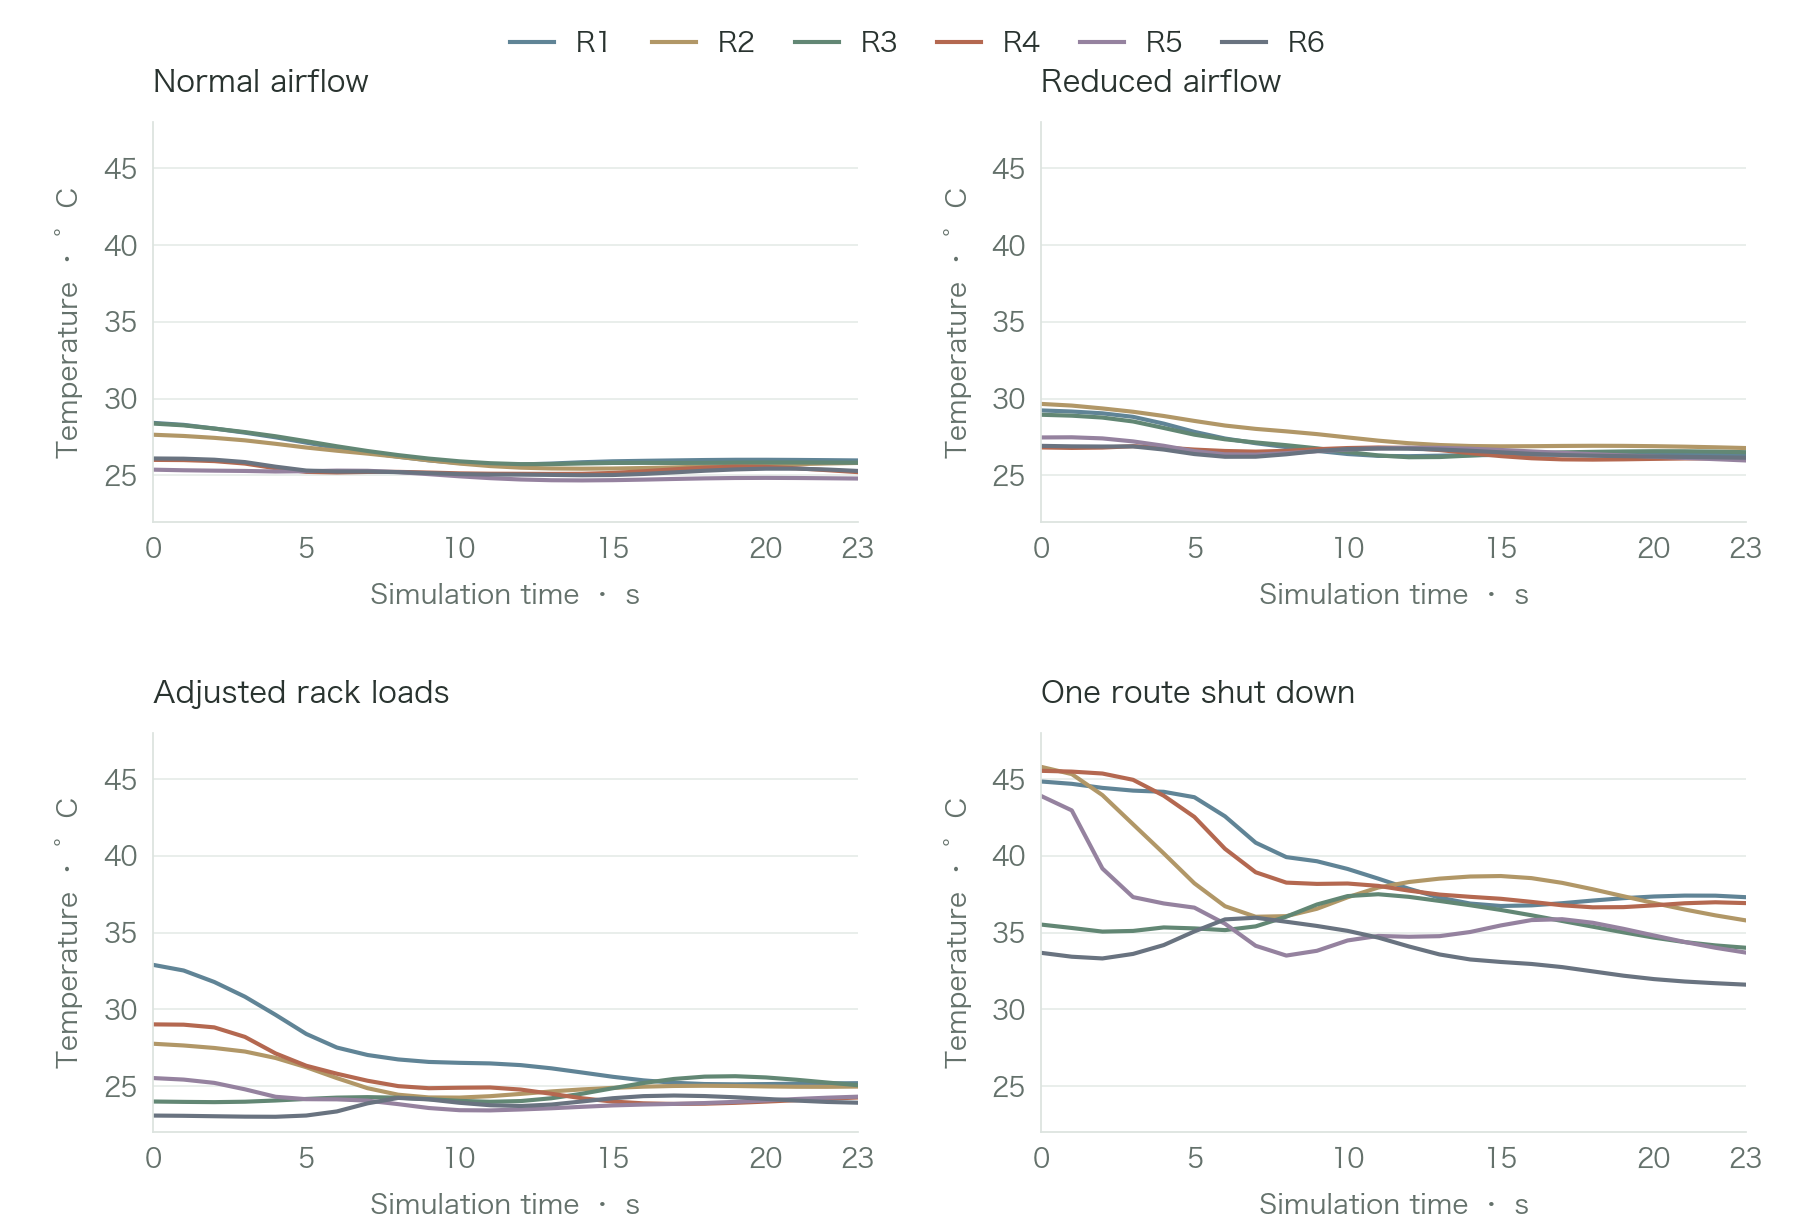
Higher rack temperatures with one route shut down
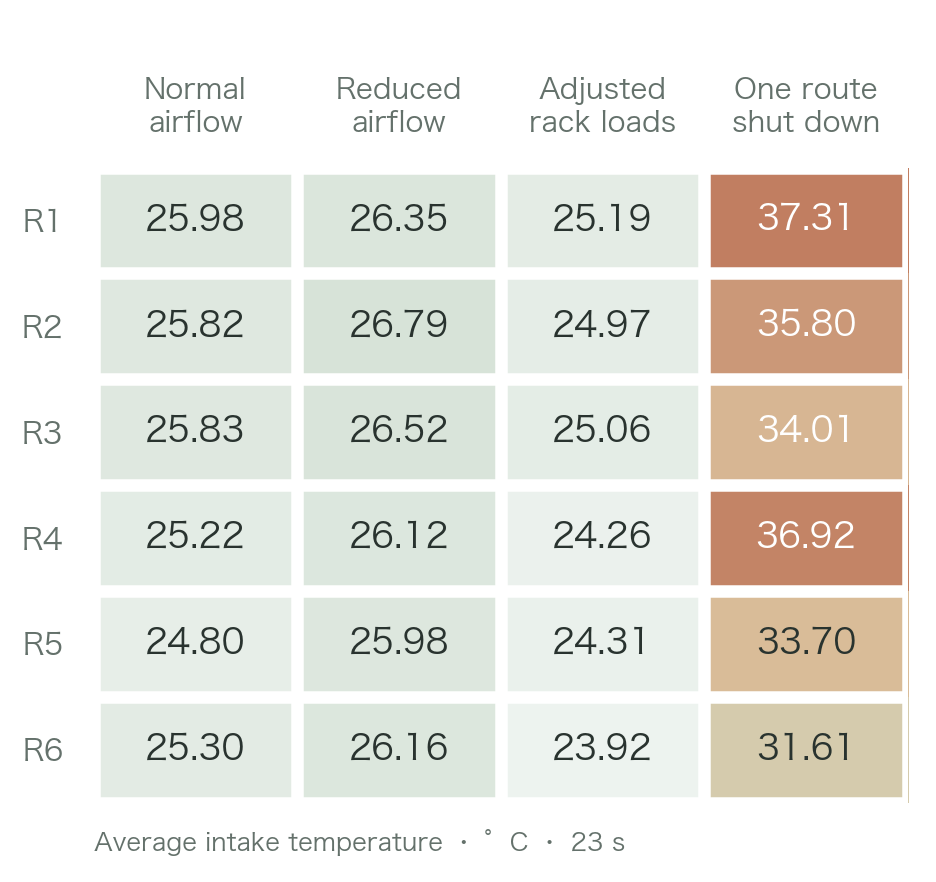
At 23 s, R4’s average intake temperature is 11.71°C above normal airflow; R5’s peak intake temperature is 44.94°C.
Higher local peaks after load redistribution
After redistributing rack loads, average intake temperatures fall across six racks, while the highest sampled room temperature rises from 34.15°C to 38.26°C.
One route shut down
Route 1 supply and return are closed; route 2 maintains 1.8 m³/s.
Average rack intake temperature · °C
R1
37.31°C
Average intake temperature · 23 s
- vs. normal airflow
- +11.33°C
- Peak intake temperature
- 43.90°C
At 23 s, R4’s average intake temperature is 11.71°C above normal airflow; R5’s peak intake temperature is 44.94°C.
Average rack intake temperatures · 23 s
R1 · intake temperature
Coarse-grid simulations over 0–23 s, with each scenario initialized separately.
| Scenario | Supply · m³/s | Highest average intake · °C | Highest intake peak · °C |
|---|---|---|---|
| Normal airflow | 3.6 | 25.98 | 31.67 |
| Reduced airflow | 2.7 | 26.79 | 33.31 |
| Adjusted rack loads | 3.6 | 25.19 | 31.31 |
| One route shut down | 1.8 | 37.31 | 44.94 |
Temperature and airflow distribution
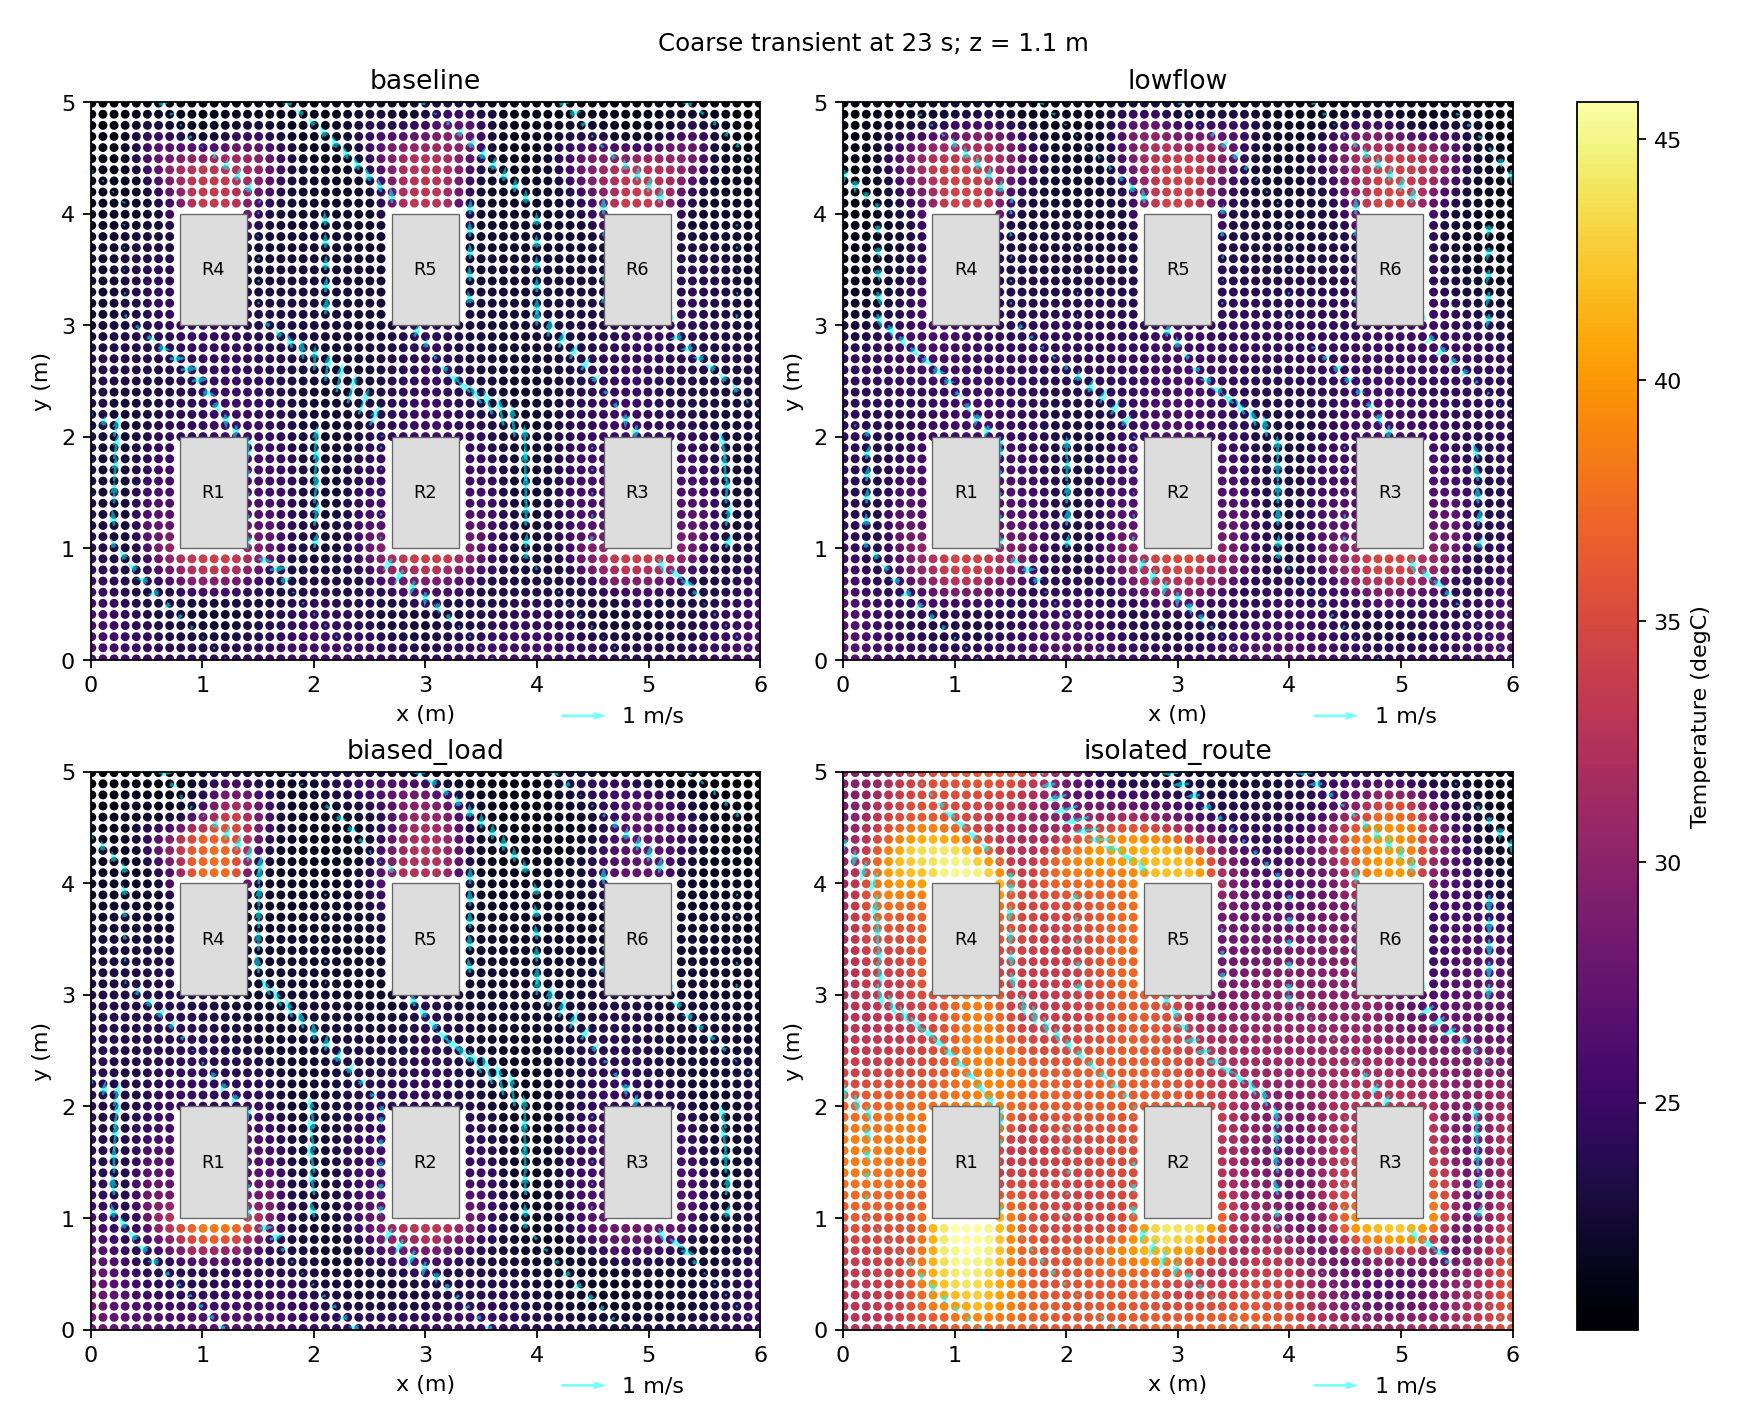
Rack temperature overview
Six-rack temperature curves